

Executive Summary
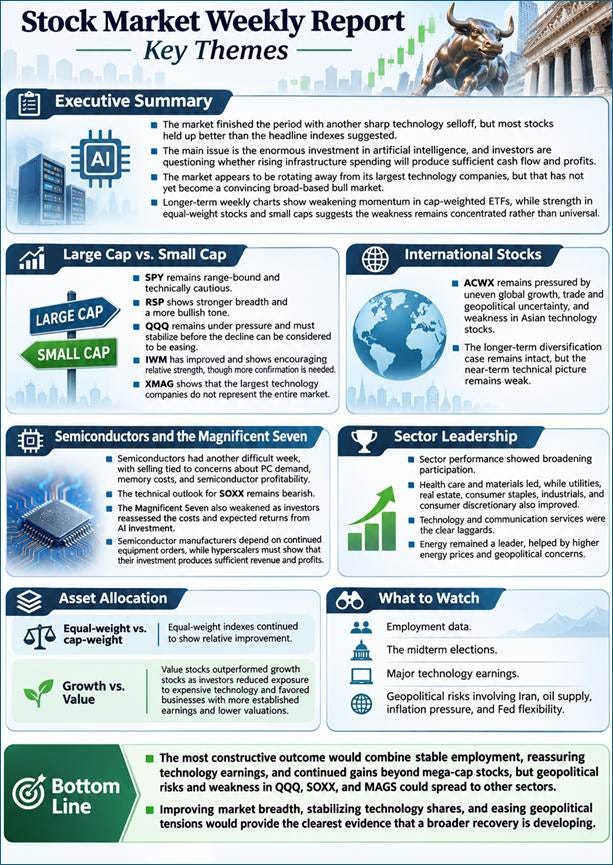
The market finished October with another sharp technology selloff, but most stocks held up considerably better than the headline indexes suggested.
Friday was the week’s worst trading session, with the S&P 500 falling 1.82% and the Nasdaq Composite losing 2.86%. The selloff followed disappointing reactions to large technology earnings and an especially sharp decline in Intel.
The central issue remains the enormous amount of money being invested in artificial intelligence. Microsoft’s results demonstrated strong cloud demand, but Alphabet and Amazon reinforced investors’ concerns about whether rapidly rising infrastructure spending will produce sufficient cash flow and profits.
The economic news was mixed. The Federal Reserve held interest rates unchanged, third-quarter GDP growth accelerated, and inflation remained well above the Fed’s target. Lower Treasury yields helped many stocks outside technology, but persistent inflation and high energy prices continued to create risks. See https://edwardlane.substack.com/p/economic-report-for-october-30-2026?r=zh7v&utm_campaign=post-expanded-share&utm_medium=web.
The week’s main conclusion is that the stock market is rotating away from its largest technology companies, but the rotation has not yet become a convincing broad-based bull market.
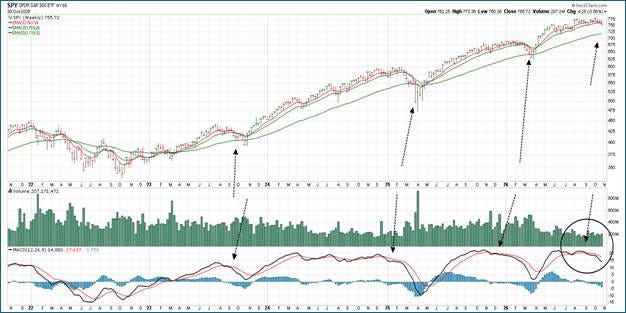
The longer-term weekly charts introduce another concern. SPY and QQQ have weakened relative to their short-term weekly moving averages, and momentum has deteriorated. Similar conditions have sometimes preceded deeper corrections toward the 50-week moving average. However, the continuing strength of RSP and IWM suggests that the weakness remains concentrated rather than universal. The next several weeks should help determine whether the market is rotating leadership or entering the early stages of a broader correction.
Large Cap vs. Small Cap & Market Breadth
S&P 500 (SPY)
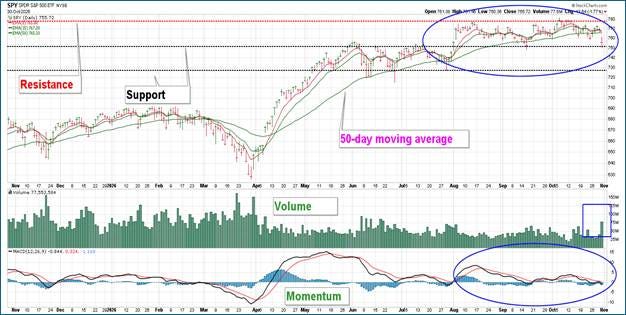
The S&P 500 remains range-bound between $750 and $780. Once again, SPY tried to recover from last week’s weakness but gave it up on Friday, moving closer to support at $750 as price fell further below the 8- and 15-day moving averages and the 50-day, a key technical break. Momentum (MACD) continued to tilt downward as last week’s downside risk extended. The near-term technical outlook remains cautiously bearish. Holding support near $750 would be encouraging, while a sustained break below that level would increase the risk of a deeper correction. Friday’s recovery from the session low offers some encouragement, but the volume spike alone does not establish that selling pressure has ended.
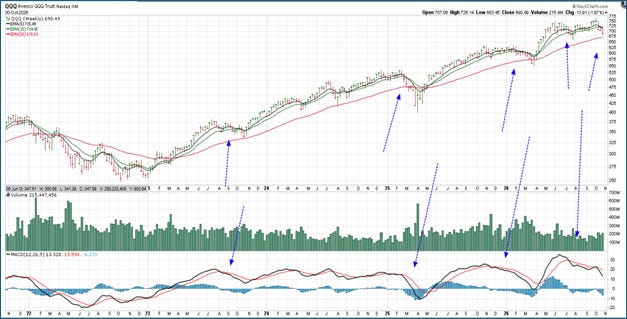
This next chart shows weekly performance for the last 5 years, with 8-, 15-, and 50-week moving averages and momentum (MACD), similar to the daily charts. The weekly charts show weakening momentum and declining prices relative to their short-term moving averages. Similar conditions have preceded deeper corrections during the past five years, sometimes bringing prices toward the 50-week moving average. That possibility warrants attention, although the earlier pattern does not establish that another decline will follow.
Equal-weight S&P 500 (RSP)
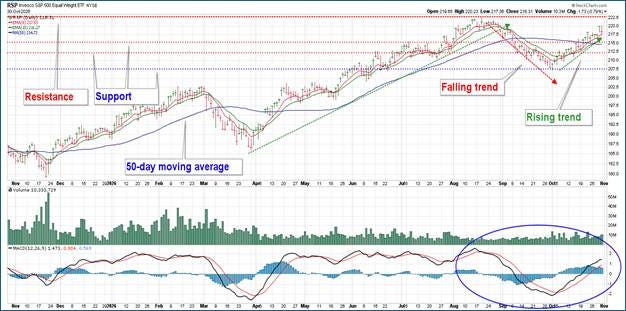
This outlook changes little from last week: The market rotation reappears in the bullish advance of the equal-weighted S&P 500 compared with the cap-weighted SPY above. The bullish outlook for RSP over the last three weeks was reinforced by a widening spread between the 8- and 15-day moving averages and the widening signal lines in the momentum indicator, MACD. Pushing further above the 50-day moving average is a strong positive signal. My outlook remains bullish. Now that price has pushed past $215, that becomes support.
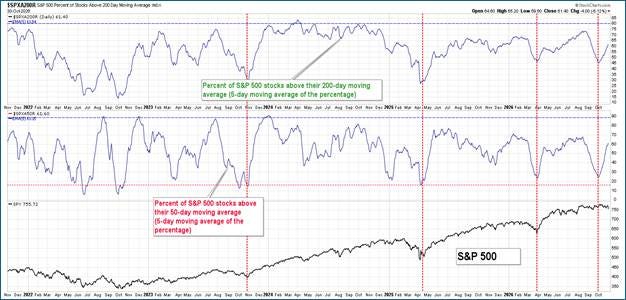
RSP’s outperformance relative to SPY, along with gains across most sectors, reinforces evidence that market participation is broadening. A sustained increase in the number of stocks above their longer-term moving averages would offer stronger confirmation.
NASDAQ 100 (QQQ)
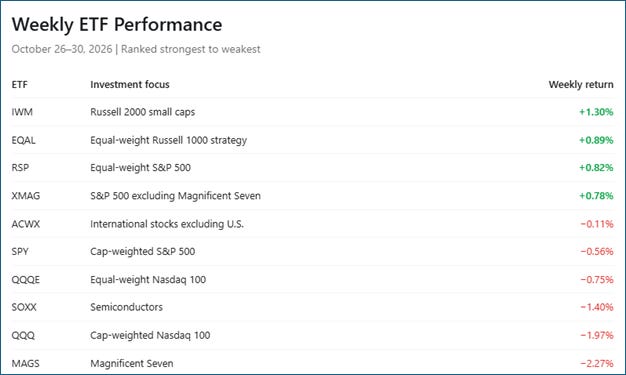
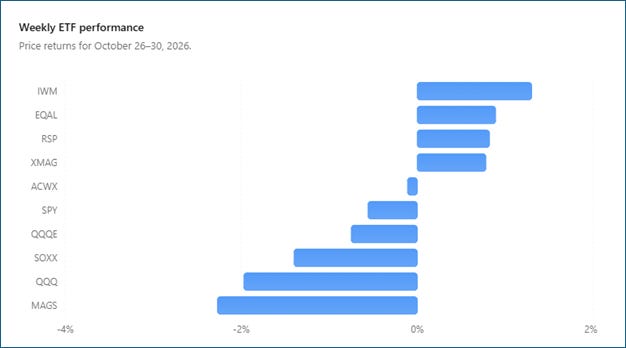
QQQ lost almost 2% last week, while QQQE lost 0.75%. This is an important distinction because both ETFs provide exposure to Nasdaq 100 companies, but QQQ places far greater weight on the largest members.
After attempting to break through resistance at $730 earlier in the week (similar to the week before), momentum faded, and price not only failed to break above the key moving averages as they deteriorated further, but fell below support at $700 in a rout of tech stocks on Friday. At this point, price will need to get back to $700 and hold above it, or face further deterioration down to the next support level at $660. Oversold conditions could produce a relief rally, but a recovery above $700 and improving momentum would be needed before concluding that the decline is stabilizing. For now, my technical outlook remains bearish.
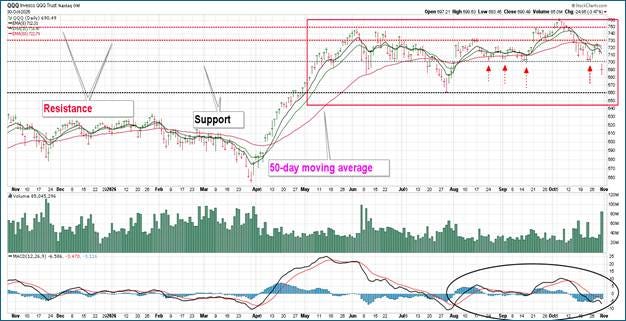
As with the S&P 500 (SPY), the long-term weekly chart for QQQ shows a concerning development: a change in momentum and how that has played out in the past, more so than for SPY. QQQ is fast approaching the 50-week moving average, a crucial support. Previous recoveries from this area have been associated with heavy volume, which we are not seeing yet in October’s performance.
All-world ex-US (ACWX)
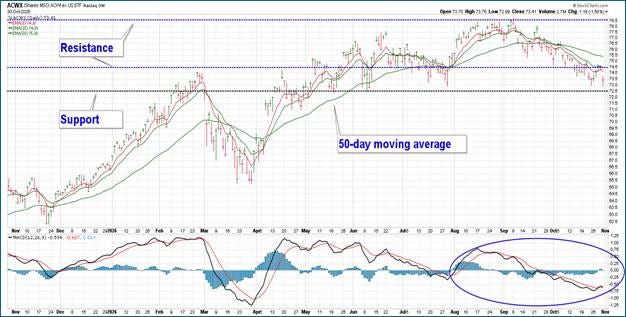
The international ETF continues to face pressure from uneven global economic conditions, uncertainty over trade and geopolitical developments, and the weakness in Asian technology companies. By region, ACWX is split mainly between Asia-Pacific (around 47%) and Europe (around 41%), with the Americas ex-U.S. — essentially Canada plus Latin America — making up most of the rest. For the week, ACWX was nearly unchanged.
ACWX attempted a recovery earlier in the week but slipped back below the $74.50 support area, closing near $73.41, close to last week’s close. That maintains the deterioration in its moving averages and MACD momentum. A recovery above $74.50 would be a hopeful improvement, while $72.50 remains the next support area identified in the chart. While the near-term outlook remains bearish, the recovery from Friday’s low and the uptick in momentum are encouraging.
The longer-term diversification case for international stocks remains distinct from the near-term technical picture. ACWX reduces reliance on U.S. companies, but it does not eliminate exposure to global technology spending, trade policy, inflation, or interest rates.
Semiconductor ETF (SOXX)
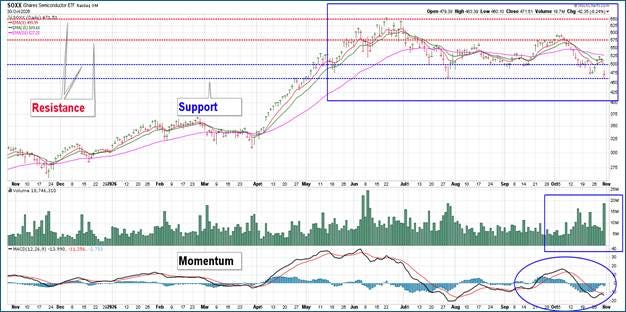
Semiconductors had another difficult week. SOXX declined 1.4%, despite strong gains earlier in the week. Friday’s 8.2% decline erased those gains as Intel’s disappointing outlook raised concerns about PC demand, memory costs, and semiconductor profitability. AMD and other chipmakers also fell sharply.
SOXX finished the week more than 28% below its June high, reinforcing the deterioration in its intermediate trend. The immediate support area is around $460–470, while resistance remains near $500.
The technical outlook remains bearish. A sustained recovery above resistance, with improving short-term moving averages and MACD momentum, would be needed before concluding the correction has ended. A short-term rebound is possible following Friday’s heavy selling and volume spike, but that would not necessarily reverse the underlying decline.
Magnificent 7 (MAGS)
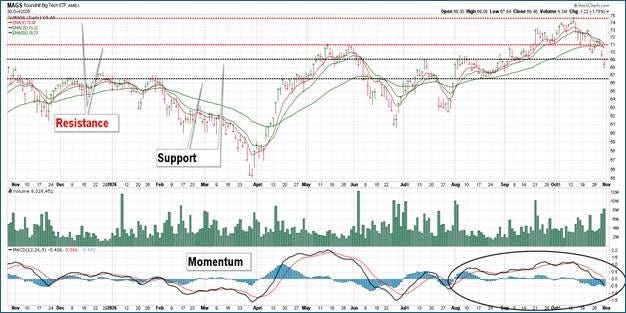
The Mag 7 includes 4 hyperscalers (Microsoft, Alphabet (Google), Amazon and Meta), Nvidia, Apple, and Tesla, and accounts for almost 35% of the S&P 500. MAGS fell 2.27% for the week and almost 4% in the last two days. That was considerably worse than SPY, though QQQ fell more. Led by Alphabet/Google, every member of MAGS except Tesla fell during the week.
The Magnificent Seven continued to weaken as investors reassessed the costs and expected returns from AI investment. Alphabet, Amazon, and Meta faced concerns about capital spending and its effect on cash flow. Microsoft reported strong cloud revenue growth and cash generation, illustrating that the financial position of the hyperscalers is not uniform.
This distinction matters. Semiconductor manufacturers depend on continued equipment orders, while hyperscalers must demonstrate that their investment produces sufficient revenue and profits. Their ability to finance expansion also differs considerably.
The technical outlook for MAGS remains bearish. The ETF failed to hold the $69 support area, making that level potential resistance. Further improvement will require a price recovery and stronger momentum.
Ex-Magnificent 7 (XMAG)
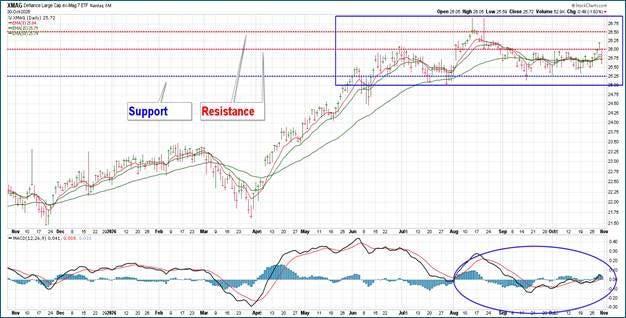
XMAG gained about 0.78% while SPY fell 0.56%. Its performance was modest, but it again showed that the largest technology companies do not represent the entire market.
XMAG excludes the Magnificent 7 while retaining capitalization-weighted exposure to other S&P 500 companies. Consequently, it can still be affected by weakness in large companies, but it is less directly exposed to the dominant Magnificent 7 stocks.
The ETF continues to trade in a relatively narrow range around $25.25–26. Its near-term technical condition appears neutral rather than decisively bullish.
While XMAG briefly closed above $26 on Thursday before falling back to the channel, the next positive development would be a sustained recovery above $26, accompanied by strengthening short-term momentum.
Small-cap Russell 2000 (IWM)
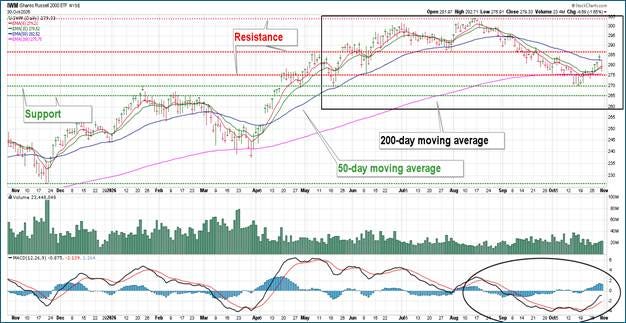
IWM gained 1.30% for the week, outperforming the other focused ETFs. The ETF bounced off support at $275, nearly reached the next resistance level near $285, then slipped back. The 8- and 15-day moving averages improved along with momentum (MACD). Bouncing off the 200-day moving average was a must and a positive sign.
IWM’s relative strength suggests that investors are becoming more willing to hold smaller companies as the largest technology stocks weaken. Lower Treasury yields may also have helped, although financing costs remain elevated. The improvement in moving averages and MACD momentum is encouraging, but additional confirmation would be needed before describing the recovery as durable.
The technical outlook has improved from cautiously neutral to cautiously bullish. The $275 area remains important support, while $286 represents potential resistance. Continued improvement in the short-term moving averages and MACD momentum would strengthen the recovery, but it is too early to conclude that a durable uptrend has developed.
S&P 500 Sector Performance
The week’s defining feature was the continued rotation away from large technology companies toward a broader range of sectors.
Nine of the eleven S&P 500 sector ETFs advanced, even as SPY declined approximately 0.6%. Health care and materials led the gains, followed by utilities, consumer discretionary, and industrials. Technology and communication services were the only sectors to finish lower.
This was another week in which the headline S&P 500 performed worse than the average stock. The equal-weight S&P 500 outperformed its capitalization-weighted counterpart, suggesting improving market participation despite continued weakness in the largest technology companies.
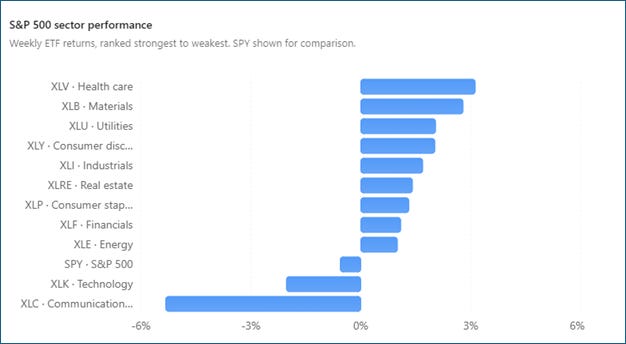
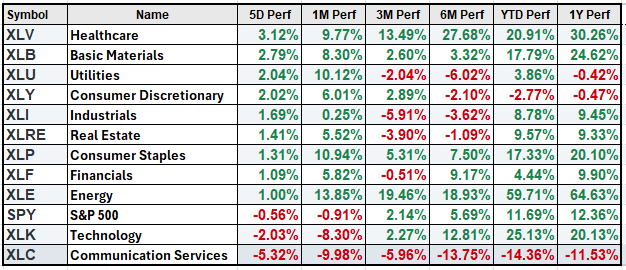
Health care and materials led the market. Health care benefited from demand for businesses with relatively dependable earnings, while materials’ strong gain suggested that investors were also willing to buy some economically sensitive companies.
Utilities, real estate, and consumer staples continued to recover. Lower Treasury yields supported interest-rate-sensitive companies and increased the relative appeal of dividend-paying stocks. Industrial and consumer discretionary shares also gained, suggesting the rotation was not exclusively defensive.
Energy remained a 2026 leader, gaining another 1% for the week. Higher energy prices and geopolitical concerns continued to support producers, although elevated fuel costs remain a risk for consumers and other businesses.
Technology and communication services were the clear laggards. Investor concerns about rising AI capital spending, future profitability, and cash flow weighed on major technology companies. Communication services suffered in particular because of their concentration in large digital businesses. Friday’s sharp technology selloff added to the week’s losses.
Asset Allocation
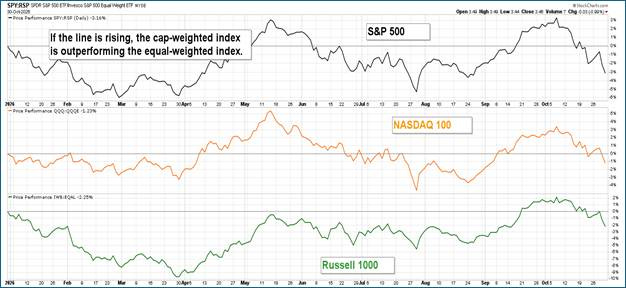
Cap-weighted vs. Equal-weighted
Recent declines in each of these three comparisons illustrate the continuing relative improvement in equal-weighted stocks. Across all three major ETFs, the equal-weight index is outperforming the cap-weighted index year to date.
Growth vs. Value
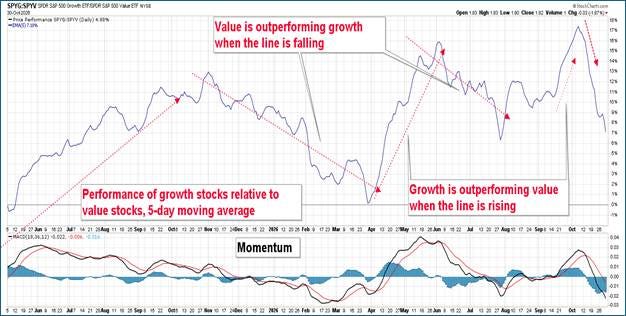
Value stocks outperformed growth stocks for the third consecutive week. SPYV gained 0.6%, while SPYG declined 1.5%, giving value a two-percentage-point advantage. Investors continued reducing exposure to expensive technology and AI-related companies while favoring businesses with more established earnings and lower valuations. The rotation has become an important feature of October’s market, but it is too soon to conclude that a lasting leadership change is underway. The next test will be whether value stocks can maintain their relative strength after the current reassessment of AI spending and technology valuations runs its course.
What to Watch November 2–6
The coming week will test whether the market’s recent rotation away from large technology companies can continue without turning into a broader correction. Employment data, the midterm elections, and major technology earnings will be the principal events. Investors will also watch whether the equal-weight S&P 500 and small caps can maintain their recent gains while technology and semiconductors attempt to recover.
Economic News
Monday’s ISM Manufacturing report will provide an early indication of business activity and inflation pressure. Tuesday brings JOLTS job openings, followed by ADP employment and ISM Services on Wednesday. Thursday’s productivity, labor costs, and jobless claims reports will provide additional information about employment conditions.
Friday’s October employment report will be especially important. Investors will focus on payroll growth, unemployment, wages, and labor-force participation. A stable labor market with moderating wage pressure would support expectations that the Fed can eventually ease monetary policy without risking renewed inflation. Weak employment, however, could raise concerns about economic growth.
Tuesday’s midterm elections introduce uncertainty surrounding fiscal policy, taxes, trade, and regulation. Market reactions may depend more on the resulting balance of power than on individual races.
Corporate Earnings
Technology earnings will be closely watched following October’s sharp selloff. Apple reports Monday, AMD and Super Micro Computer Tuesday, and Qualcomm and Arm Wednesday.
The central question remains whether strong AI demand is generating sufficient revenue, profits, and cash flow to justify the enormous investment in computing infrastructure. Investors will watch capital spending plans, margins, forward guidance, and signs of slowing demand.
Strong earnings alone may not be enough if investors remain concerned about valuations.
Geopolitical Risks
The conflict involving Iran remains an important source of market uncertainty. Recent tanker attacks and the possibility of further military escalation threaten oil shipments through the Strait of Hormuz. Diplomatic efforts offer a possible route toward reduced tensions, but another escalation could push energy prices higher, increase inflation pressures, and limit the Federal Reserve’s flexibility. The war in Ukraine and changing U.S. trade relations add further uncertainty, particularly for international stocks.
Bottom Line
The most constructive outcome would combine stable employment, reassuring technology earnings, and continued gains beyond mega-cap stocks. However, geopolitical risks, particularly the conflict involving Iran and potential disruptions to Middle East oil supplies, could push energy prices higher, prolong inflation, and limit the Fed’s flexibility. The principal market risk is that renewed inflation concerns and weakness in QQQ, SOXX, and MAGS spread to other sectors. Improving market breadth, stabilizing technology shares, and easing geopolitical tensions would provide the strongest evidence that a broader market recovery is developing.
This report is for informational and educational purposes only. It is not investment advice, an offer, or a solicitation to buy or sell any security. All investments involve risk, and you should consult a qualified financial professional regarding your unique circumstances. Past performance does not guarantee future results